SBAS Stripmap (GPOD)
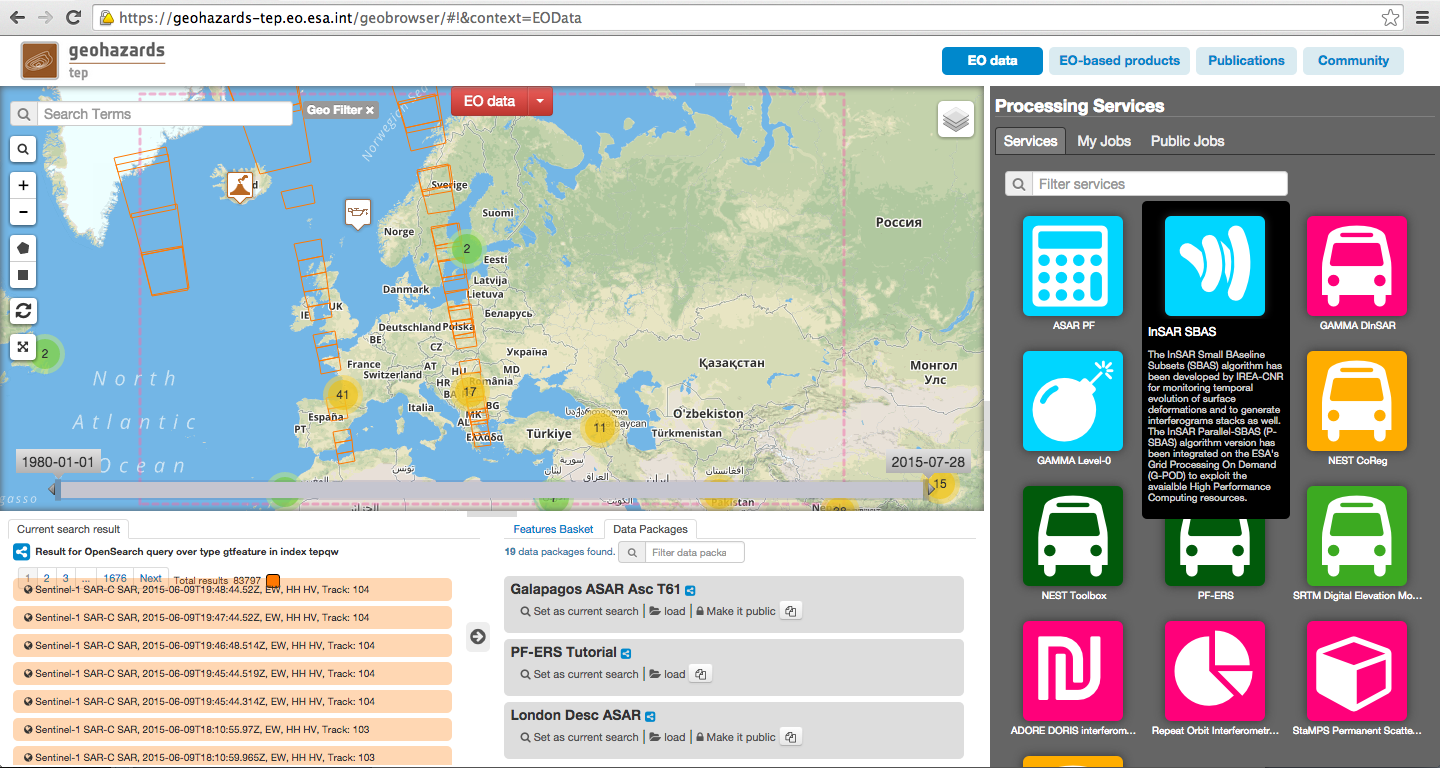
The InSAR Small BAseline Subsets (SBAS) algorithm has been developed by IREA-CNR for monitoring temporal evolution of surface deformations and to generate interferograms stacks as well. The InSAR Parallel-SBAS (P-SBAS) algorithm version has been integrated on the ESA’s Grid Processing On Demand (G-POD) to exploit the available High Performance Computing resources.
EO sources supported:
- ENVISAT ASAR L0/ ERS L0 (CEOS format)
Output specifications
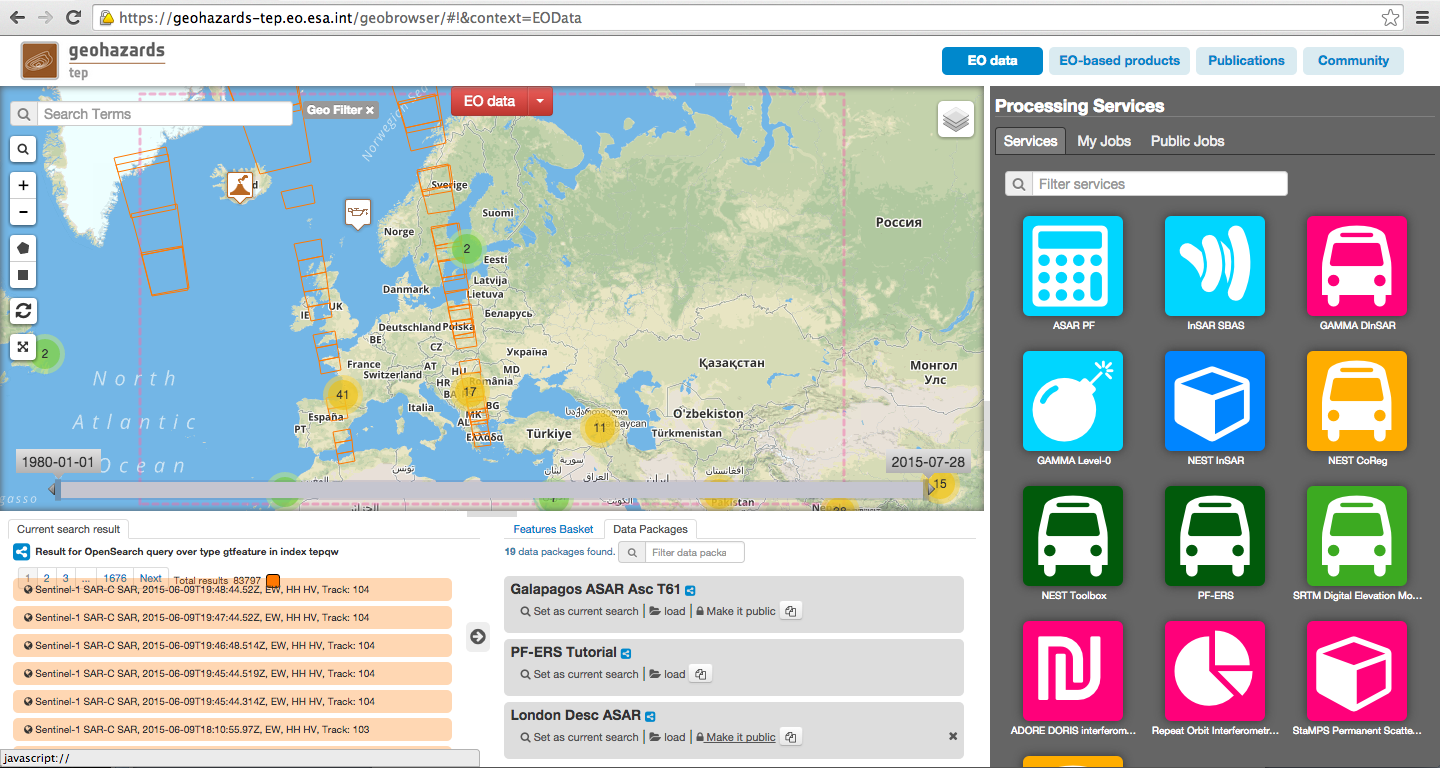
This tutorial describes how to submit a job for the SBAS-InSAR service to obtain a ground displacement time series from ERS and/or ENVISAT ASAR data. The tutorial is addressed to users already familiar with InSAR processing, analysis and products, and gives some hints and recommendation for the best service usage experience.
The provided service performs the full SBAS-InSAR chain from RAW data (Level 0) focusing to displacement time series generation.
The main user actions are the following:
As additional feature, the possibility to generate single or stack of interferograms co-registered to a single master geometry is also available.
Users are encouraged to use the SBAS-InSAR service here described for scientific purposes. Please, note that commercial use (including service provisioning) of any part of this service is not allowed without express permission from the CNR-IREA Institute and ESA. Being this service available for free for scientific use, please recognize the effort made by the authors by citing:
F. Casu, S. Elefante, P. Imperatore, I. Zinno, M. Manunta, C. De Luca and R. Lanari, “SBAS-DInSAR Parallel Processing for Deformation Time-Series Computation,” IEEE JSTARS, vol. 7, no. 8, pp. 3285-3296, 2014, doi: 10.1109/JSTARS.2014.2322671
in relevant talks and publications prepared by using SBAS-InSAR results generated by this service. CNR-IREA and ESA do not respond in any case for the use, interpretation, and quality of the obtained measurements.
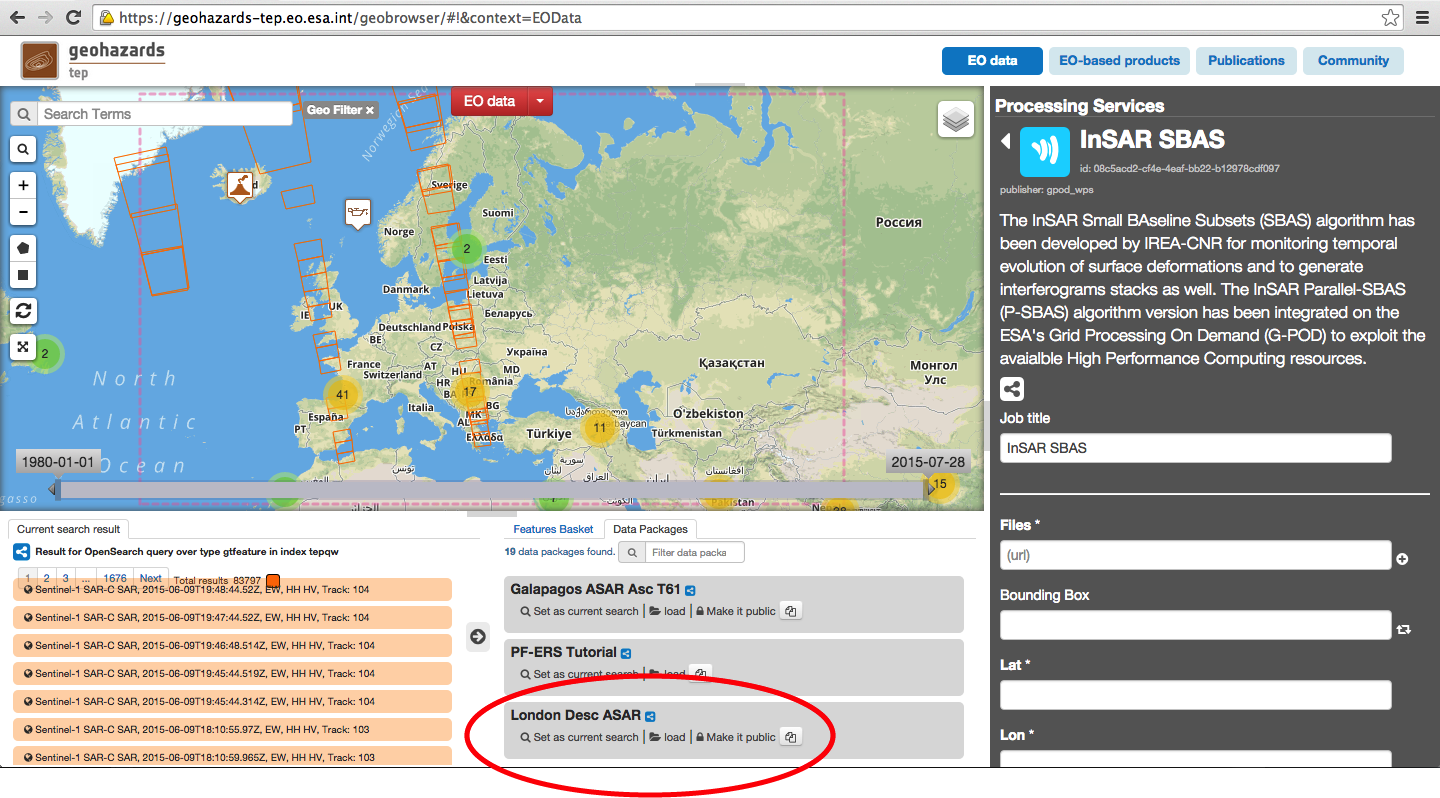
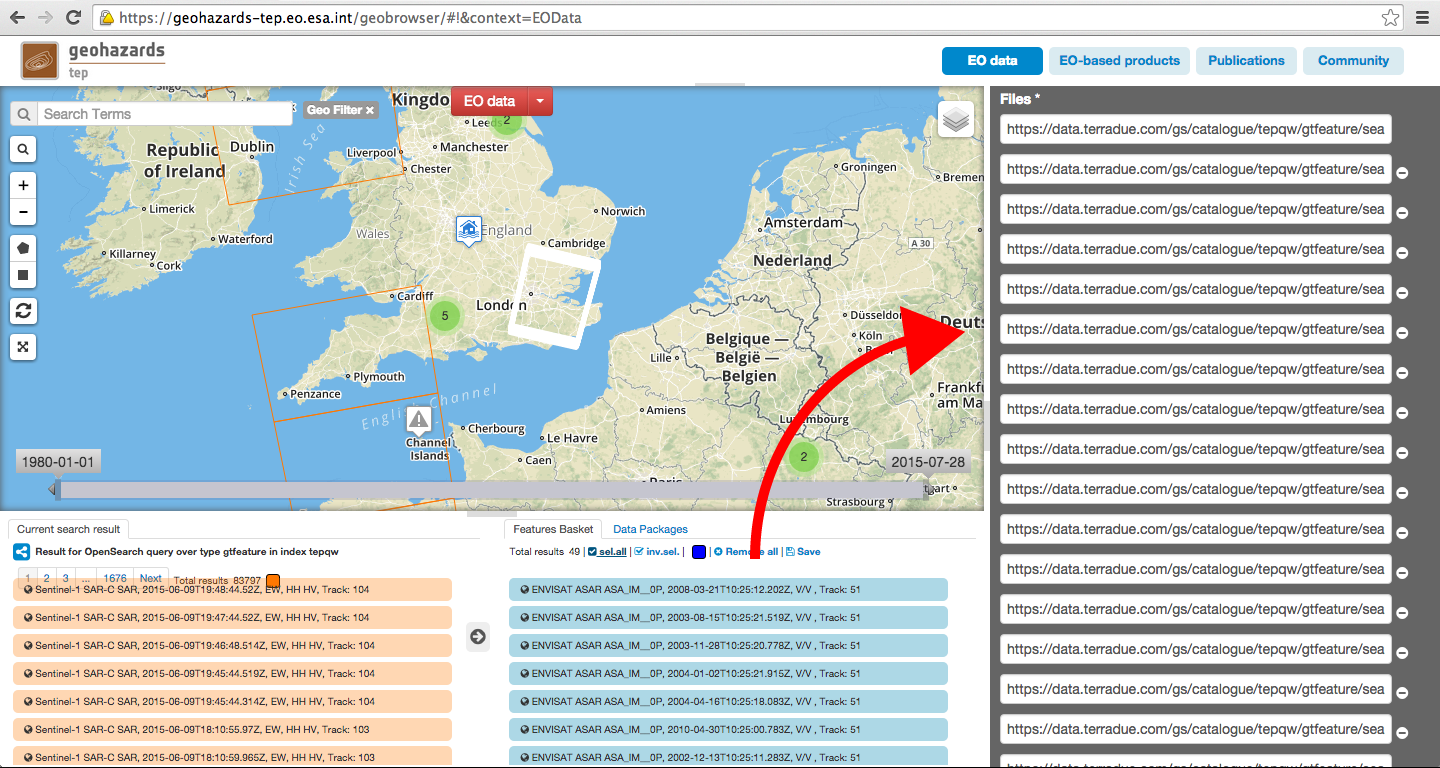
Input SAR data selection must be carried out with particular care, since a wrong data selection can result to an unfeasible processing.
For this tutorial, a pre-defined data set has been prepared to speed up data selection step.
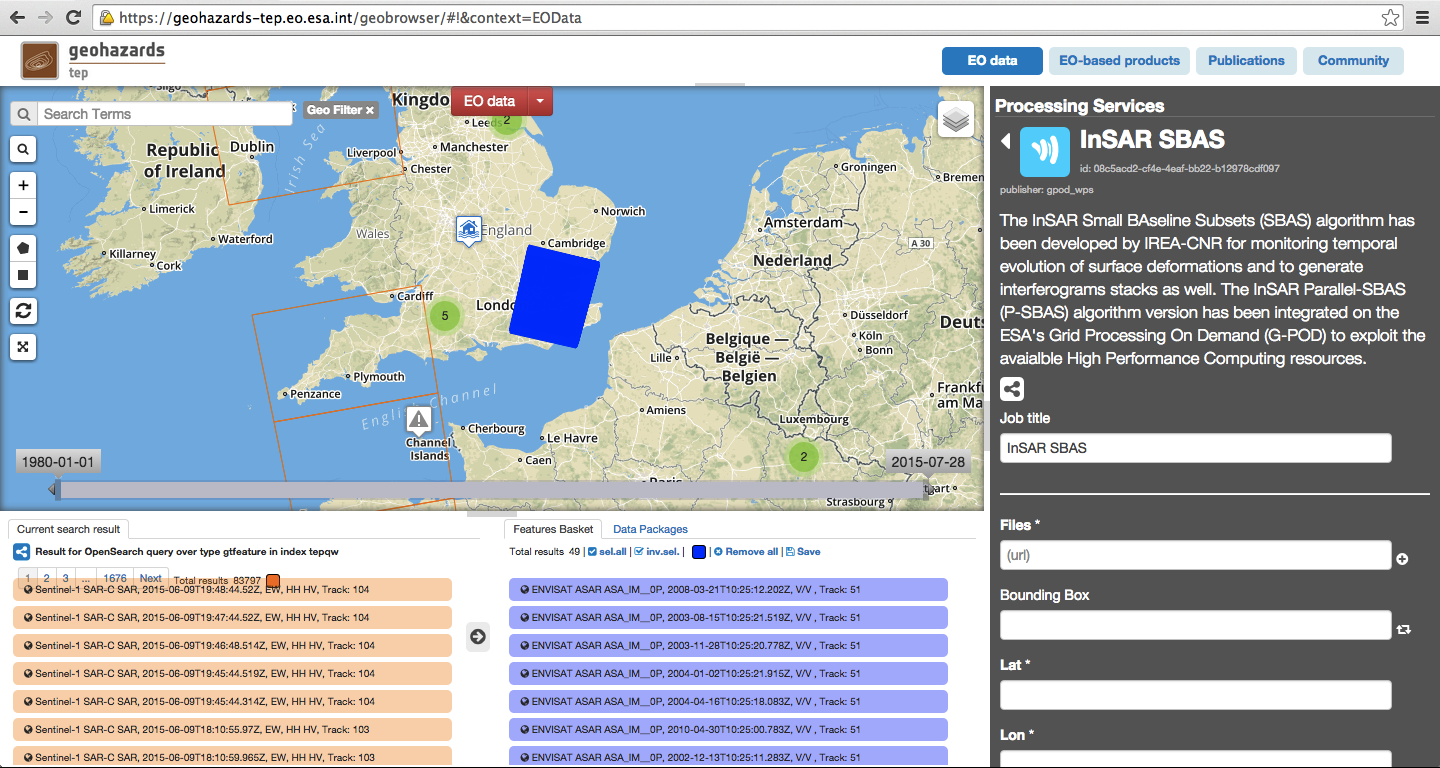
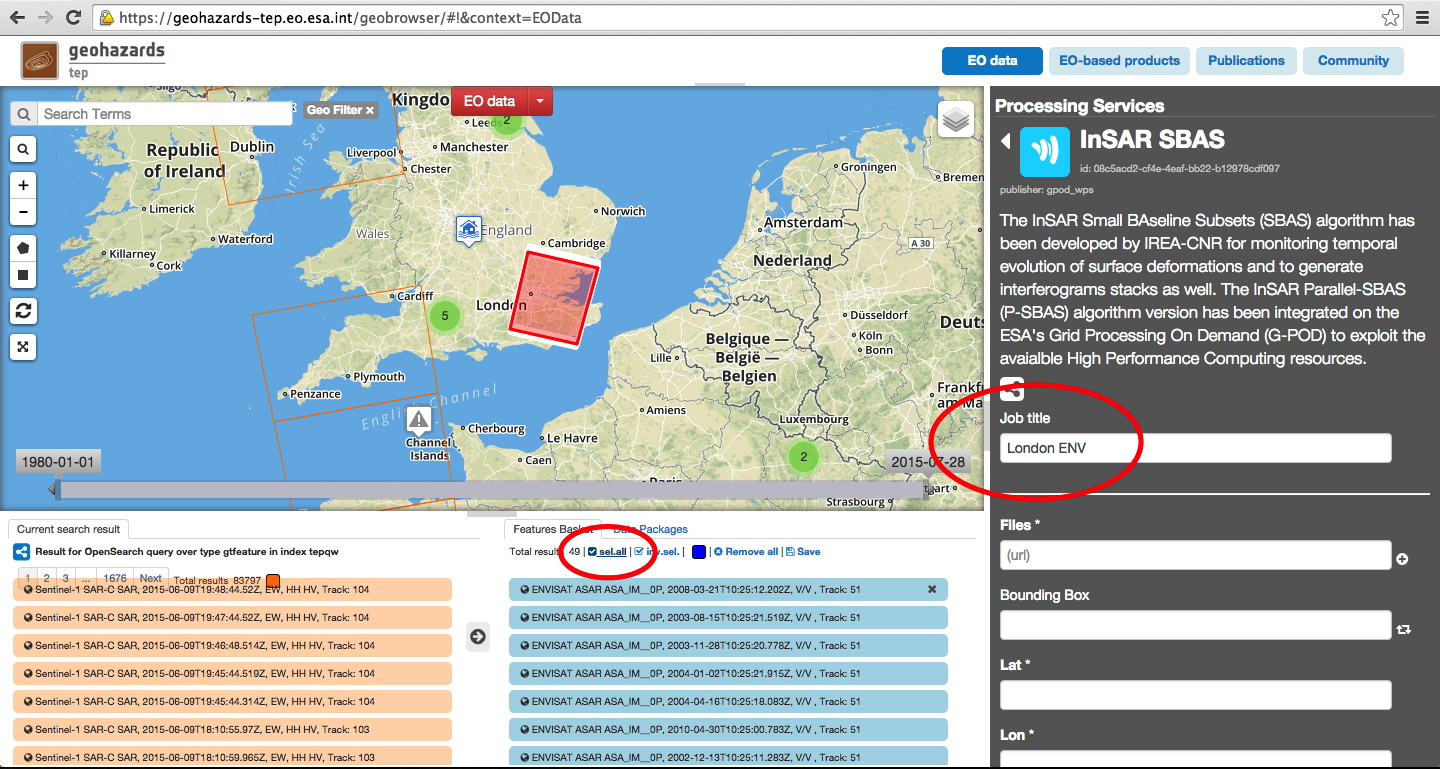
Leave the Bounding Box untouched (Area of Interest empty).
Note
This field is needed when the subsequent Cut data over selected AoI flag is set to “true”.
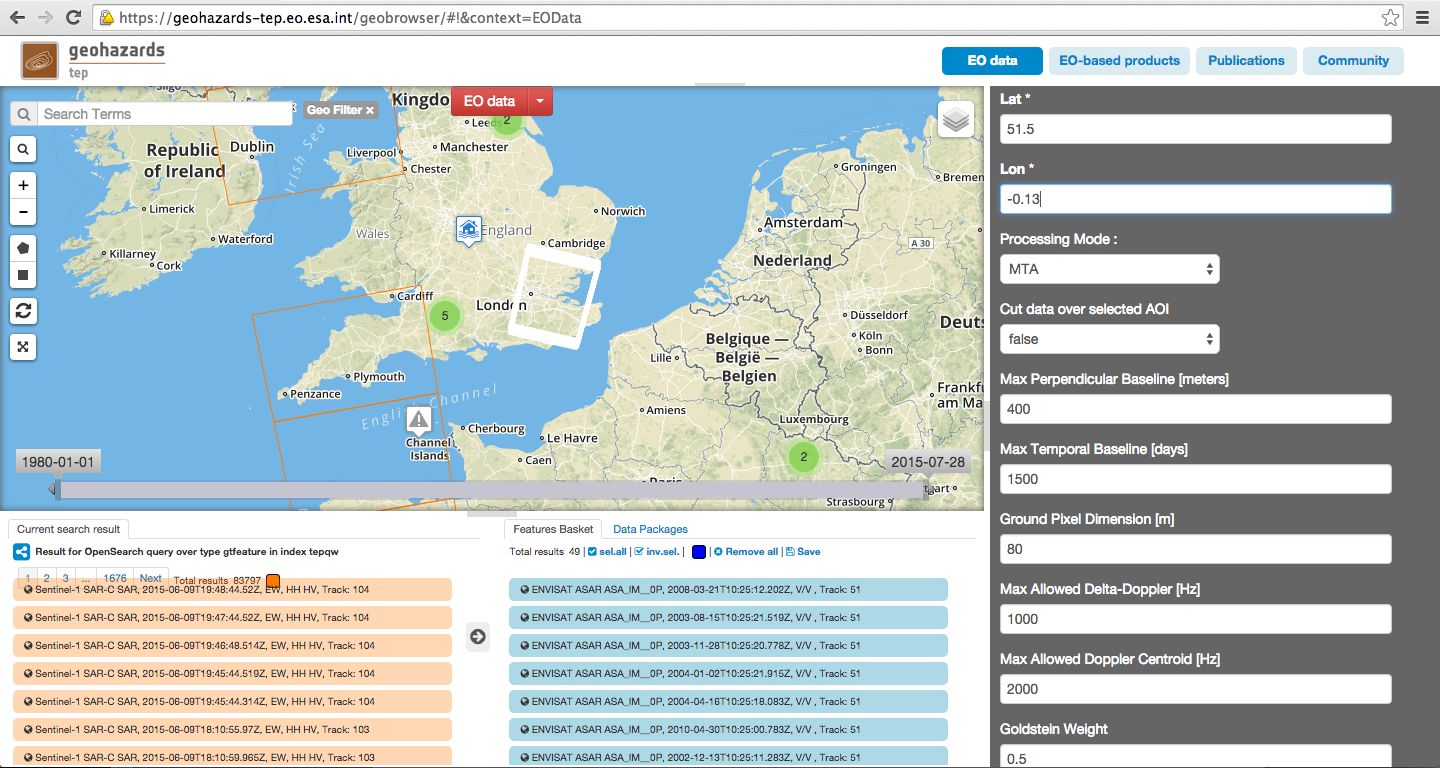
51.5
-0.13
Lat and Lon are the Latitude and Longitude coordinates (in decimal degrees) of the reference point for the SBAS-InSAR measurement. It should be located in a stable area or its deformation behaviour shall be known. In any case, the user shall verify that input Lat and Lon coordinates are on land and included within the selected area. As a suggestion, urbanized areas are usually well suitable to locate the reference point.
false
Note
When “true”, the system automatically process the AOI identified by the Bounding Box selection.
The area along the SAR strip is selected according to the following example diagram, with definitions provided for the Area of Interest, Processed Area, and Reference point.
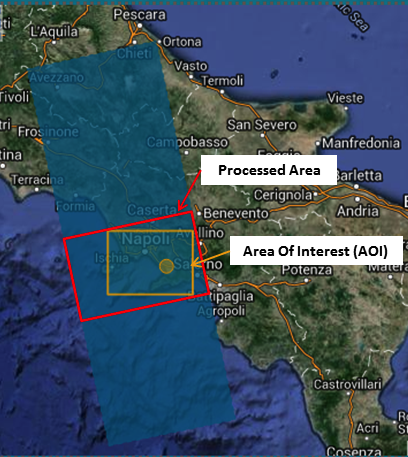
Acquisitions that do not cover the selected area are automatically discarded. In any case, within this processing mode, the size of the processed area along the azimuth direction ranges between 15000 and 40000 full resolution lines. This feature is available only for ASAR data and ERS data in ASAR format and it is particularly useful for processing the long strips.
Time Series Generation (or MTA for Multi-Temporal Analysis)
Note
You can leave all the other fields unchanged. Note that the default values work fine for almost all the ERS and ENVISAT cases.
For sake of completeness, in the following a brief description of each parameter is provided:
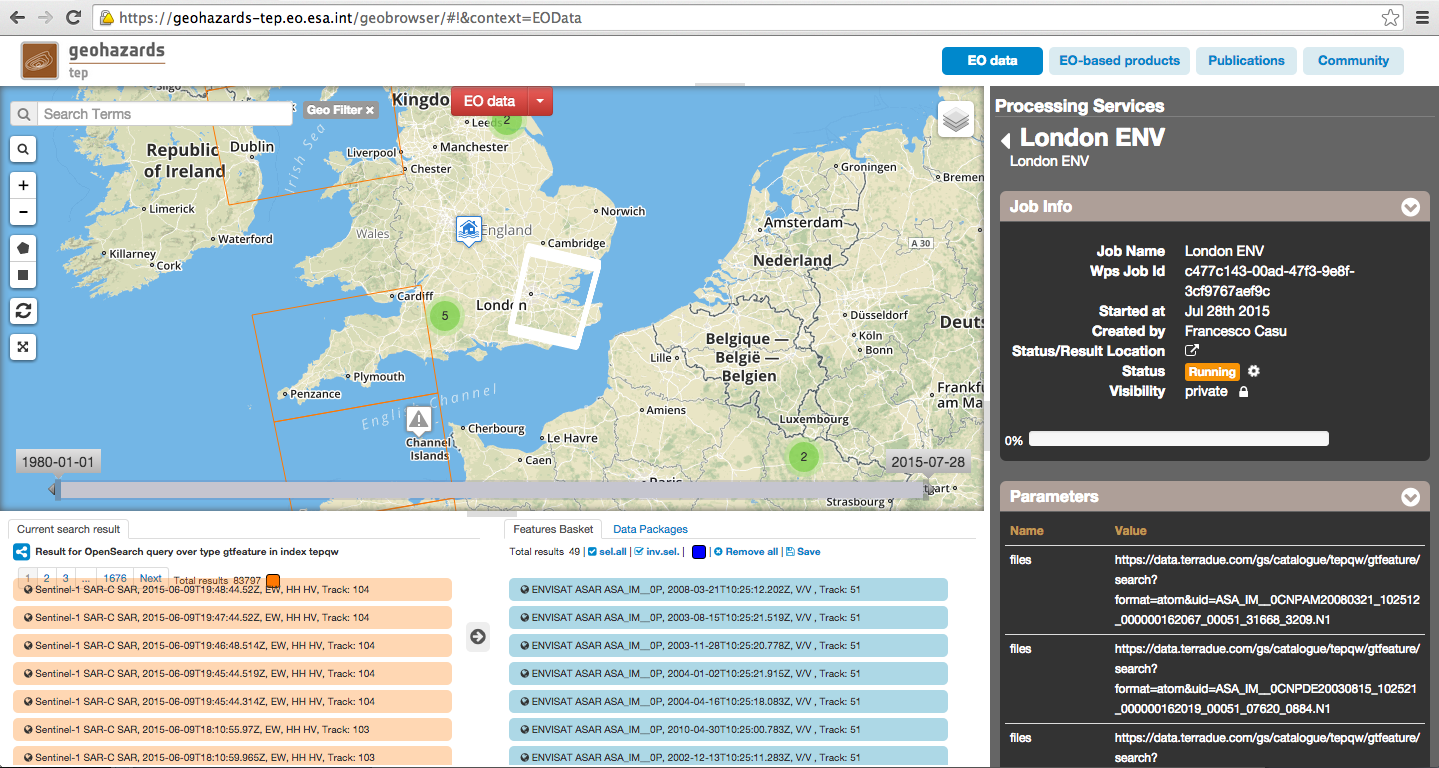
InSAR results available in the Web Portal after processing
The result that the user will find on web portal are strongly depending on the selected Processing Mode.
Conventions and assumptions
Results are provided in the satellite Line Of Sight. Positive values indicate that the target moves toward the satellite. Note that all the published binary files (.dat) are in 32-bit floating point raster format (if not differently specified) without any header information. The origin of each binary matrix is located in the Lower Left corner. Results provided in SAR coordinates have the Azimuth direction along the columns (X) and Range direction along the rows (Y). Results provided in GEO coordinates (Lat-Lon WGS84) have the Longitude direction along the columns (X) and the Latitude direction along the rows (Y). In the naming convention, the <ddmmyyyy> represents the day, month and year of a specific date while <SSS> is a three character code referring to the used sensor (e.g, ERS, ENV, ...).
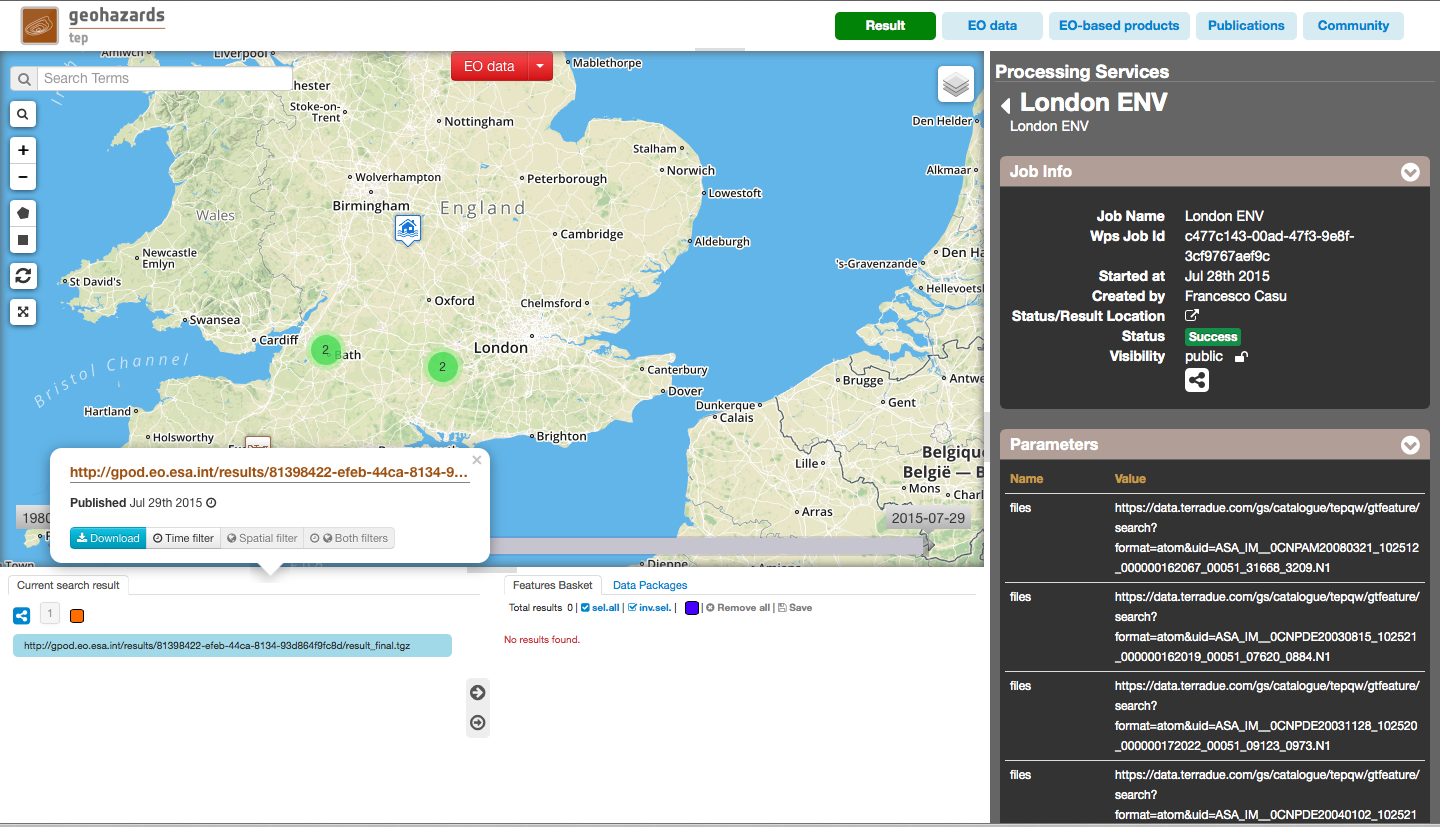
Published Results
For the Interferogram Generation Mode a .tgz folder related to each interferogram pair (in the format <ddmmyyyySSS>_<ddmmyyyySSS>.tgz) is published; each folder contains:
For Time Series Generation Mode a .tgz folder named “result_final” is published, which contains:
One ASCII file containing all the outputs of the SBAS-InSAR chain processing.
The first record contains, respectively: the number of field of each record; the number of acquisitions used in the time series and the measure unit for the mean displacement velocity.
The second record contains the list of the epochs of acquisitions used in the time series, given as fraction of year. In particular, the following relation explains the correspondence between the actual date and its representation as fraction of the year:
yyyy.ffff = yyyy + (mm-1)/12 + dd/365
where, yyyy.ffff is the acquisition epoch represented as fraction of the year (where ffff is the decimal part), while yyyy, mm and dd are the year, month and day, respectively, assuming that a date is represented as: ddmmyyyy. For instance, the date 17052013 corresponds to: 2013 + (5-1)/12 + 17/365 = 2013.3799
All the others records contain, per each pixel:
The basic scheme of the output ASCII file is reported in Figure 1.
The file name is: SBAS_output4GIS_<ddmmyyyySSS>_<ddmmyyyySSS>.txt, where the two date indicate the starting and ending acquisitions used for generating the displacement time series.
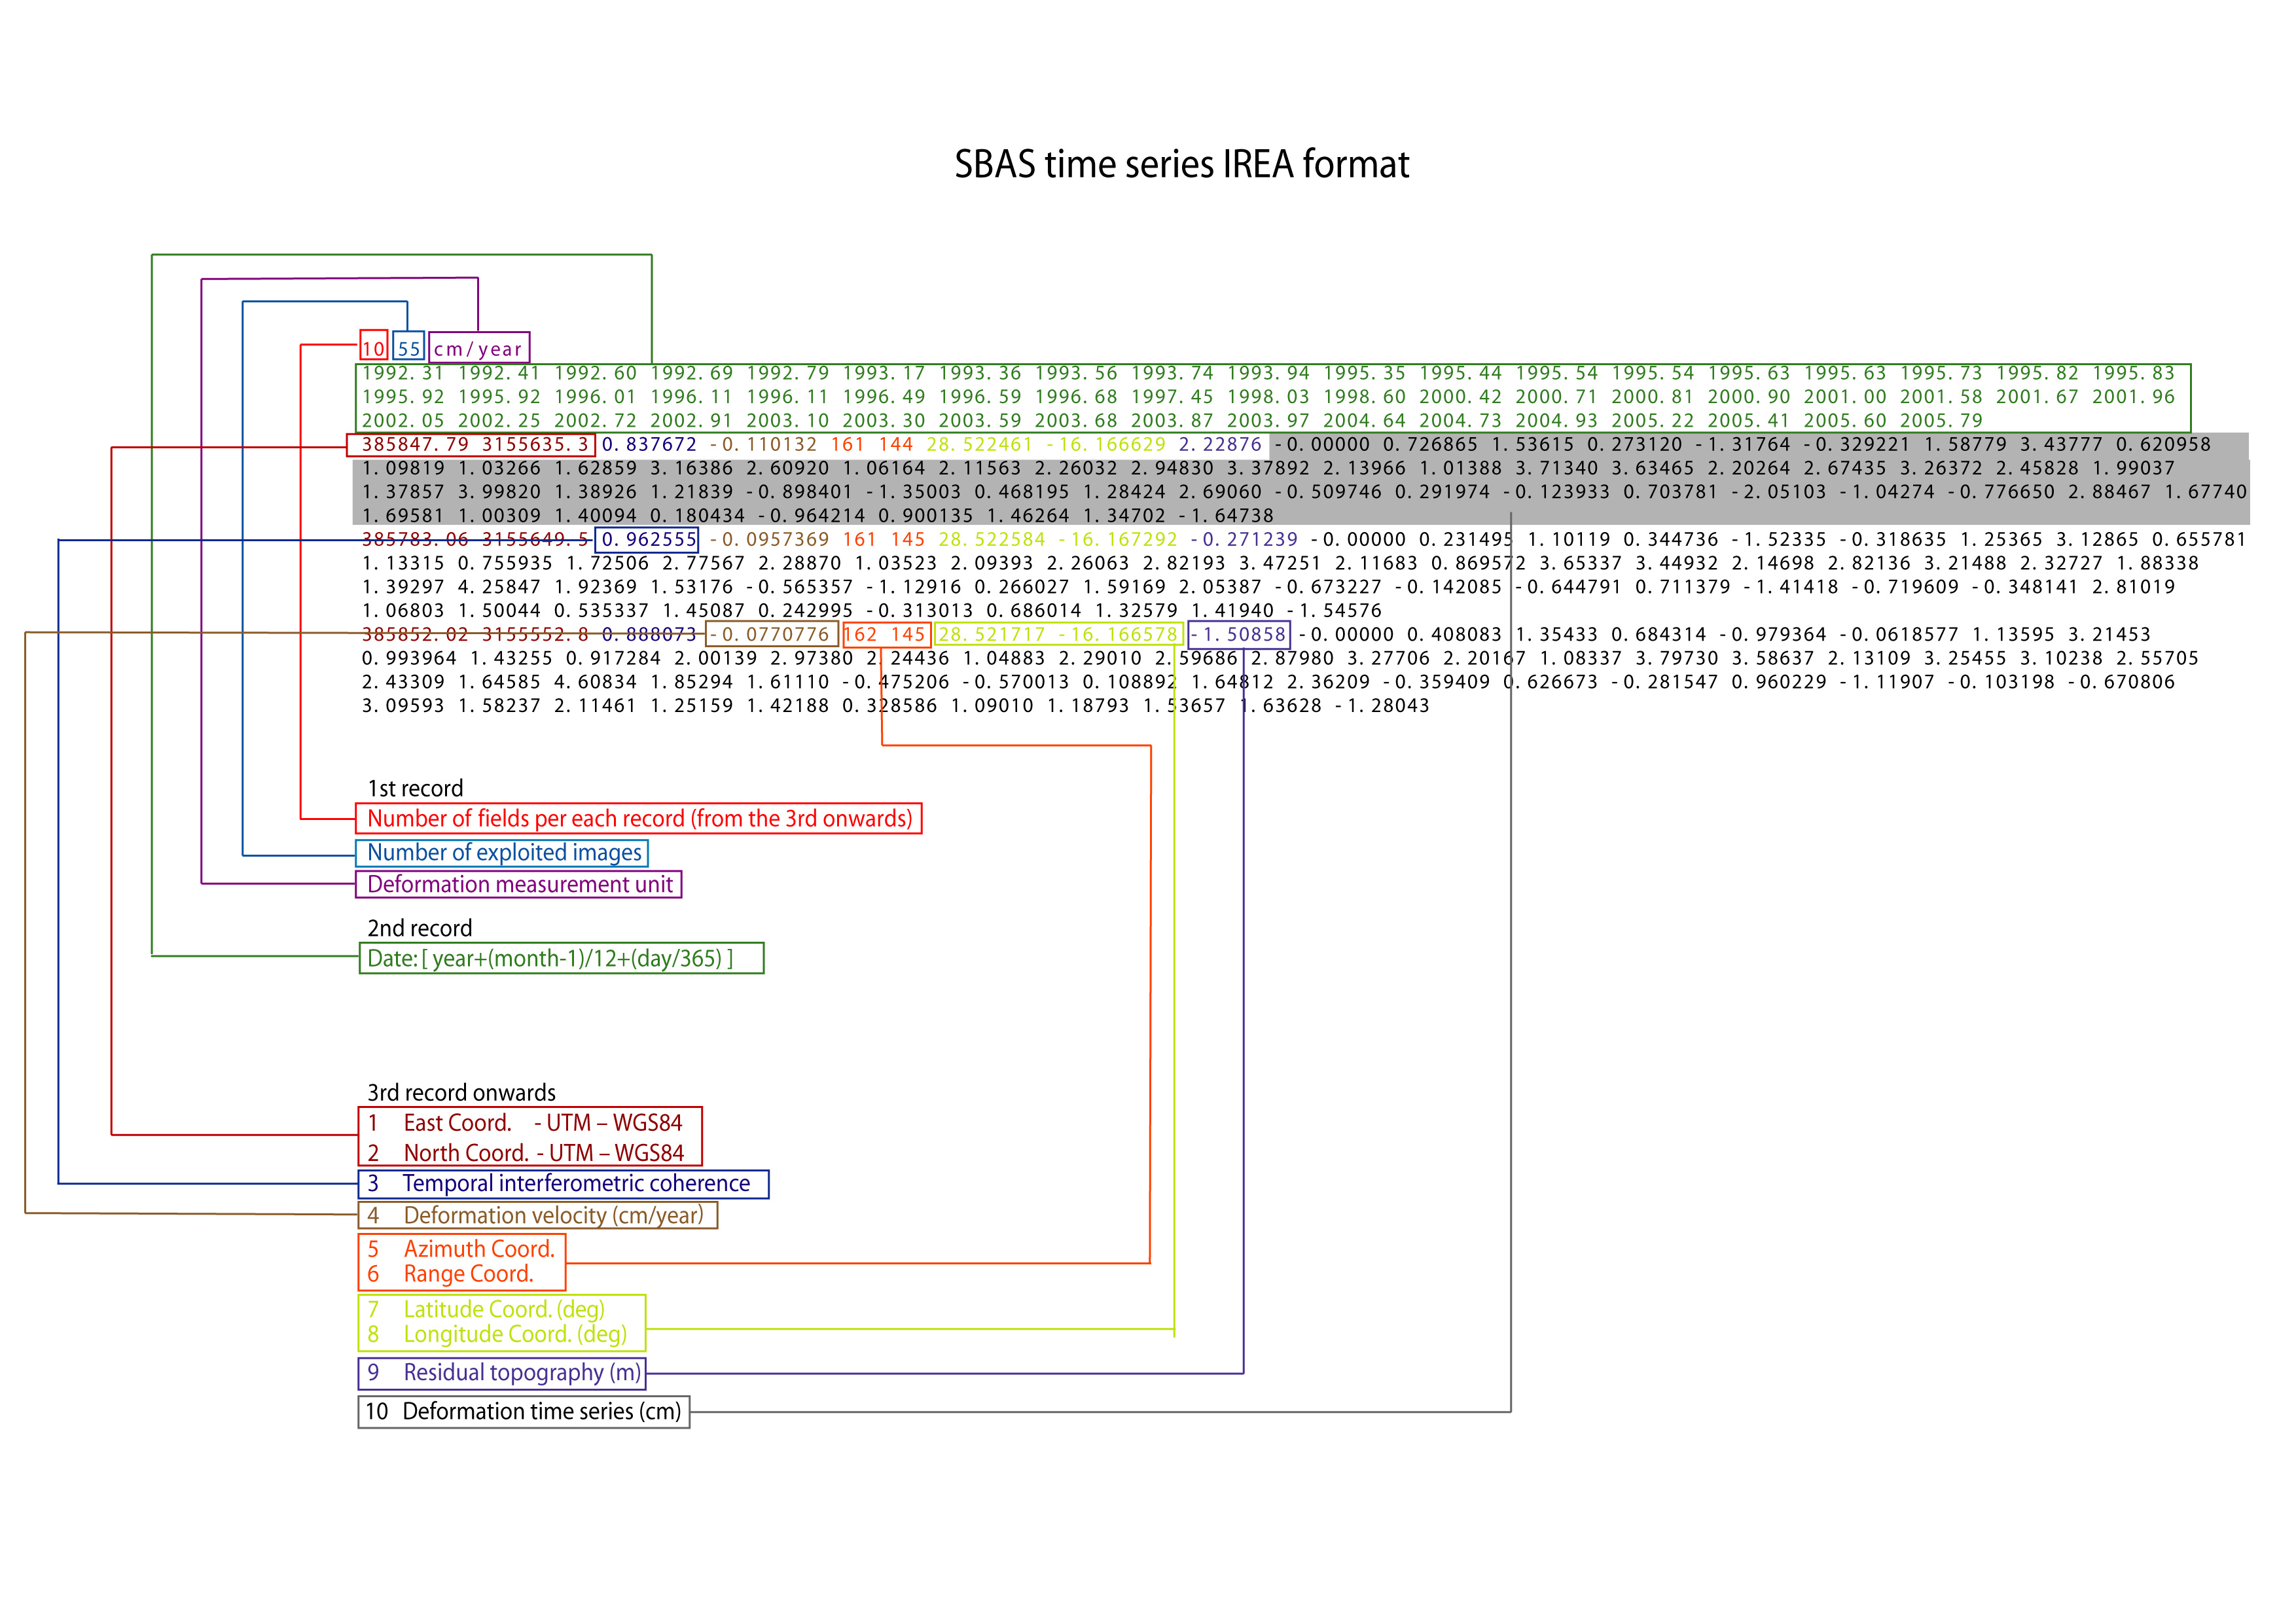
Figure 1: Format of the ASCII file, which encloses the outputs of the SBAS-InSAR processing chain.
Feedbacks
Users are also kindly invited to report any issue and problem encountered during the use of the SBAS service:
Moreover, suggestions and comments about the GEP service delivery are warmly welcomed on geohazards-tep@esa.int in order to keep the service delivery on GEP as much as possible appealing, effective and efficient.