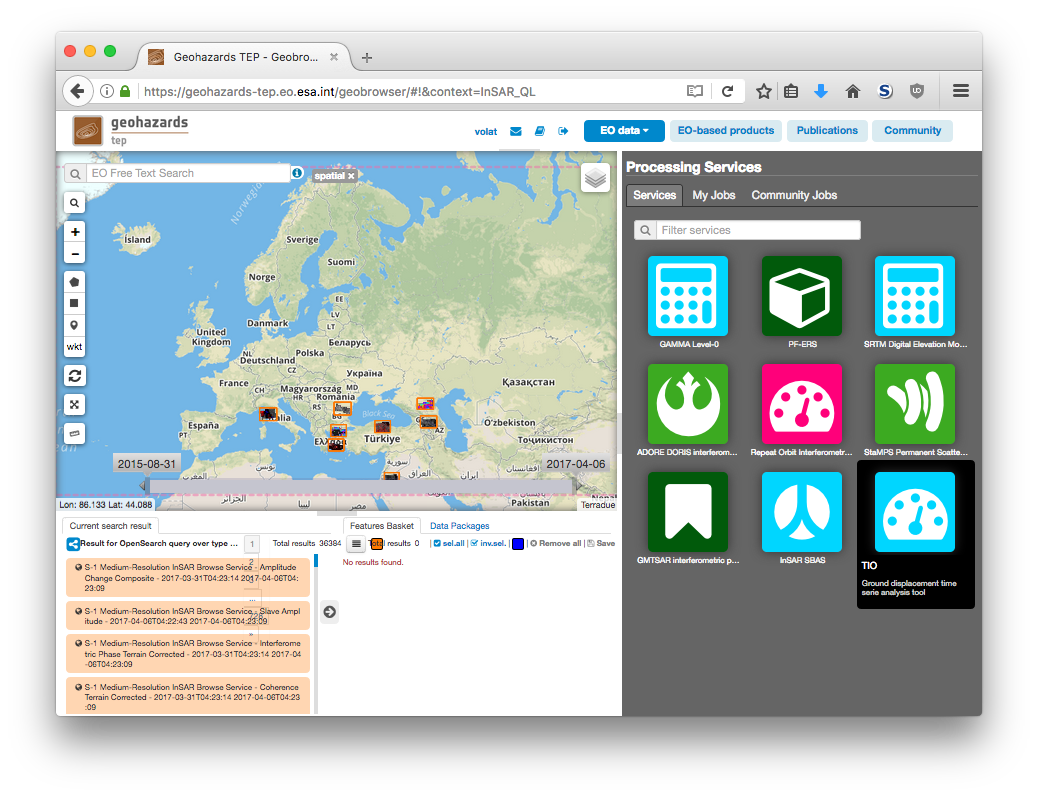
The TIO service process a set of correlation maps between different acquisition dates and produce a time serie analysis based on the methods described in [BontempsRSE2017].
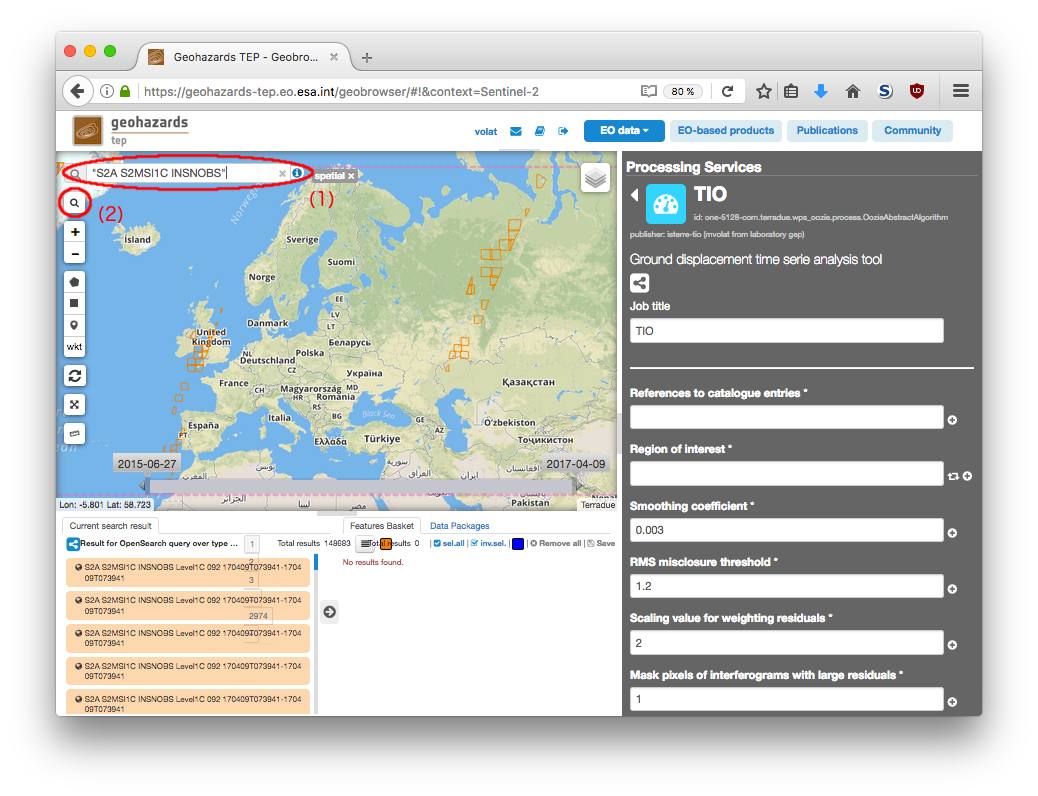
This tutorial will show how to use this service to produce such result using the geoportal. In this example, we will process Sentinel-2 data over the Harmalière (France) landslide during summer 2016, as described in [LacroixRSE2017].
| [BontempsRSE2017] | Noélie Bontemps and Pascal Lacroix and Marie-Pierre Doin (2017), “Inversion of deformation fields time-series from optical images, and application to the long term kinematics of slow-moving landslides in Peru”, Remote Sensing of Environment |
| [LacroixRSE2017] | Pascal Lacroix and Grégory Bièvre and Erwan Pathier and Ulrich Kniess and Denis Jongmans (2017), “Use of Sentinel-2 images for the detection of precursory motions before landslide ruptures”, Remote Sensing of Environment |
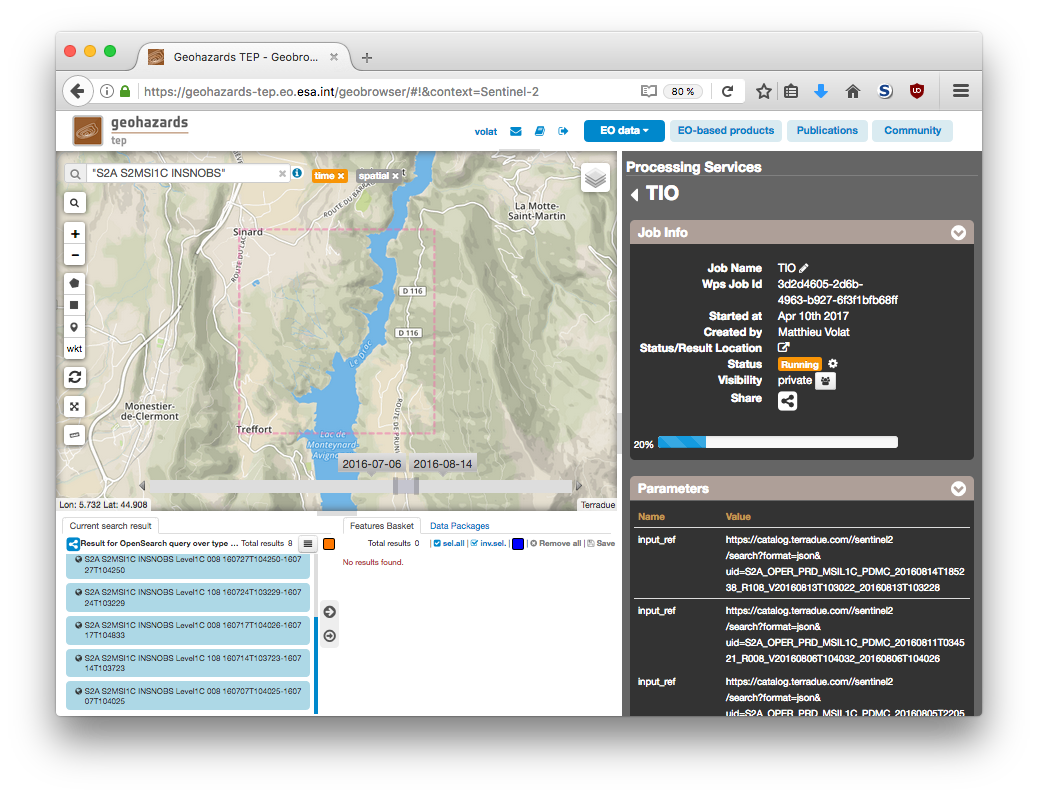
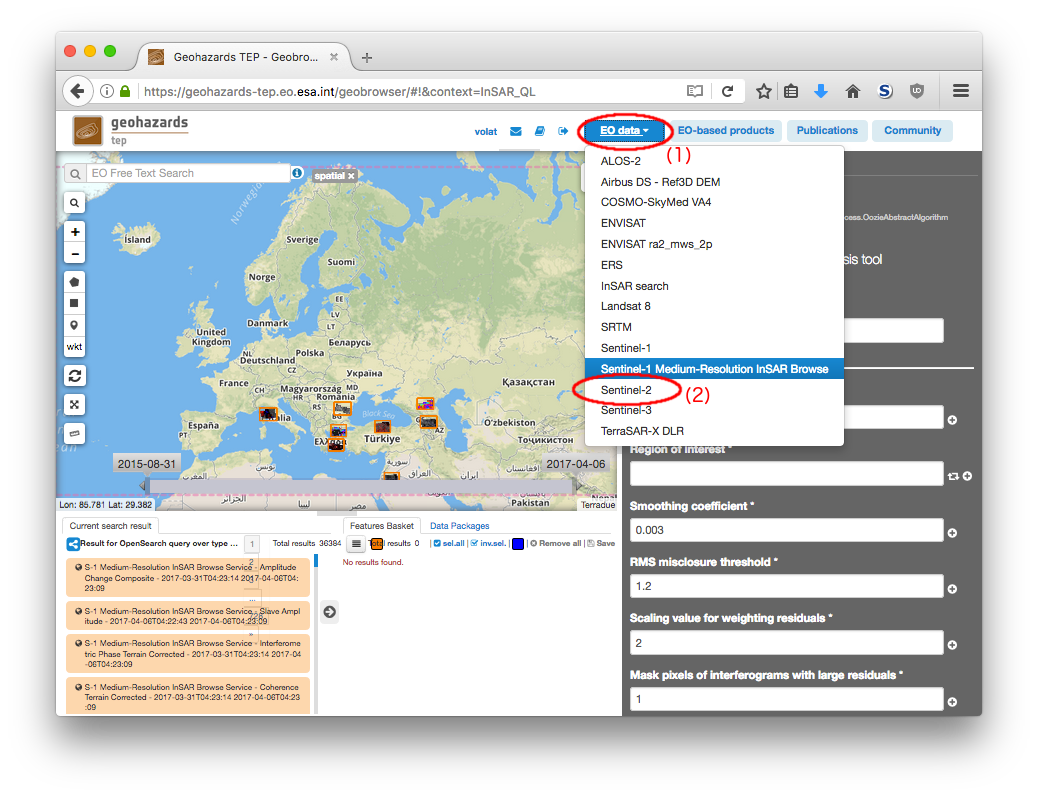
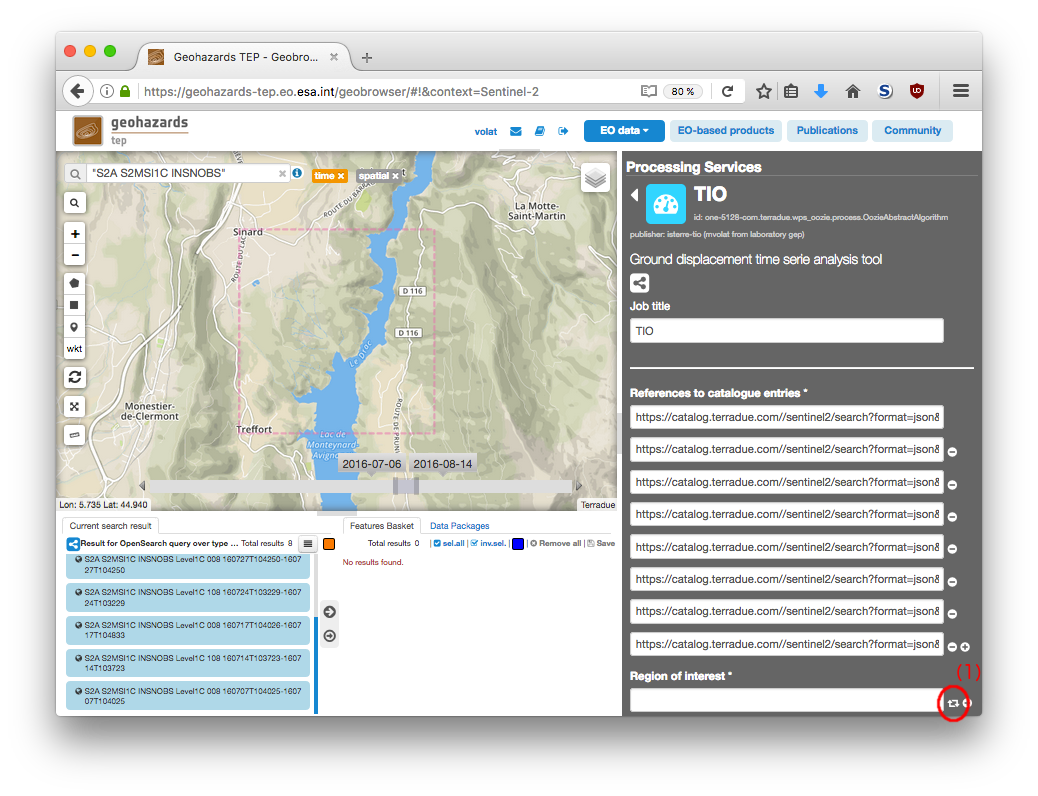
The “TIO” panel is displayed with parameters values pre-filled with reasonnable defaults, but no inputs.
Note
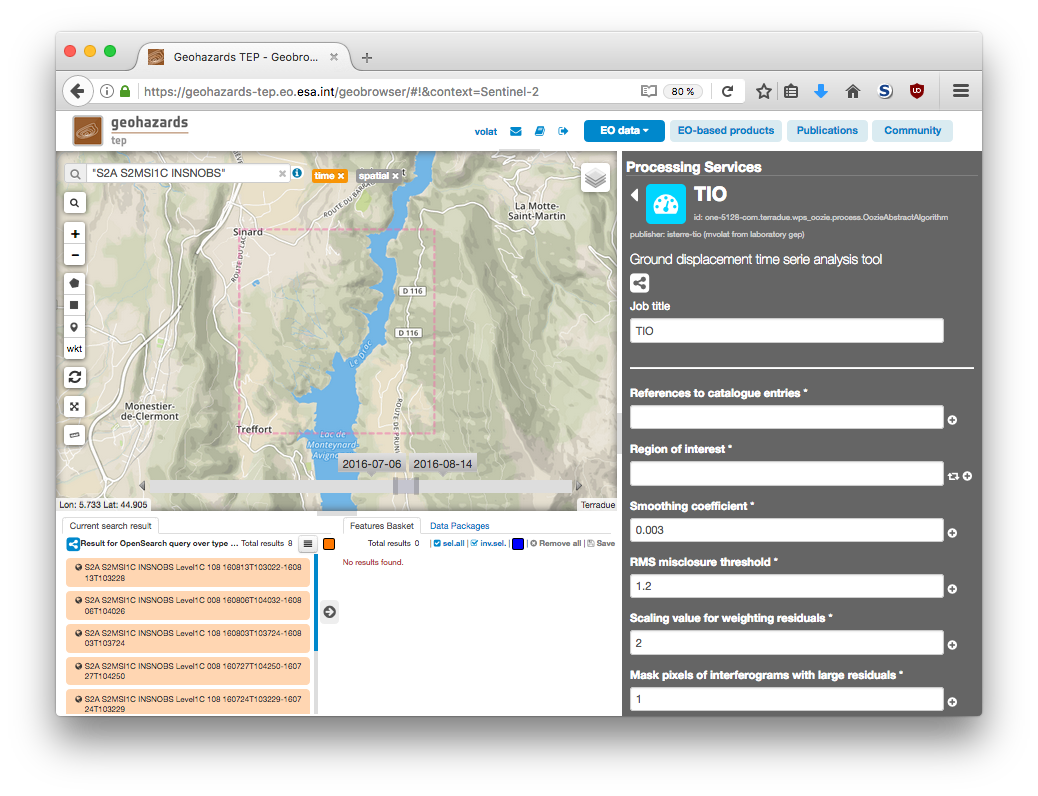
These parameters could be selected from other part of the geobrowser interface, such as the slider at the bottom or the map for the time frame, or using the area selector.
Note
Some of these images will be too cloudy to produce any result, but the service will filter them automaticaly by estimating the mean value of the “water vapor mask”. The threshold value can be tuned using the “Cloud level threshold” parameter (for advanced users).
Note
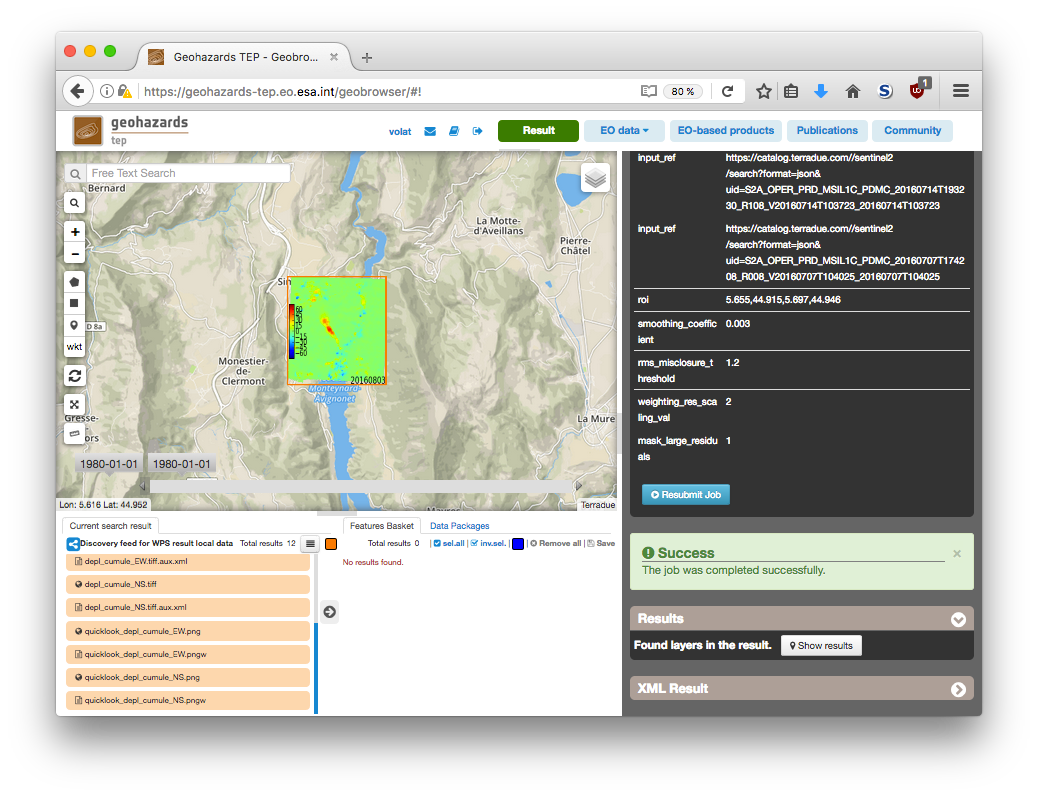
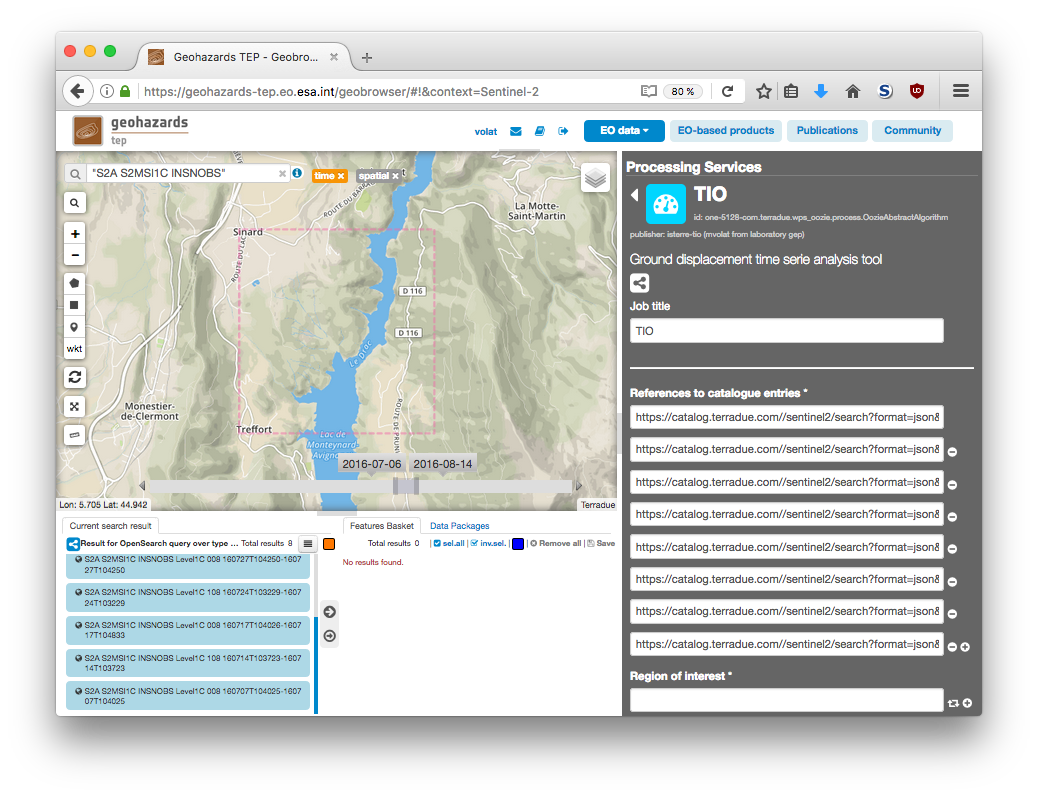
The region of interest parameter define what subset of the optical products we will process, or how different product must be mosaiced. It also allows to lower the computation time and disk space requirements by processing a smaller area.
Caution
It is important that the region of interest is a subset of the imagery products. It is not advised to select an area of interest that overlap between orbits trajectory as results are not predictable between the time the satellite orbit the earth.